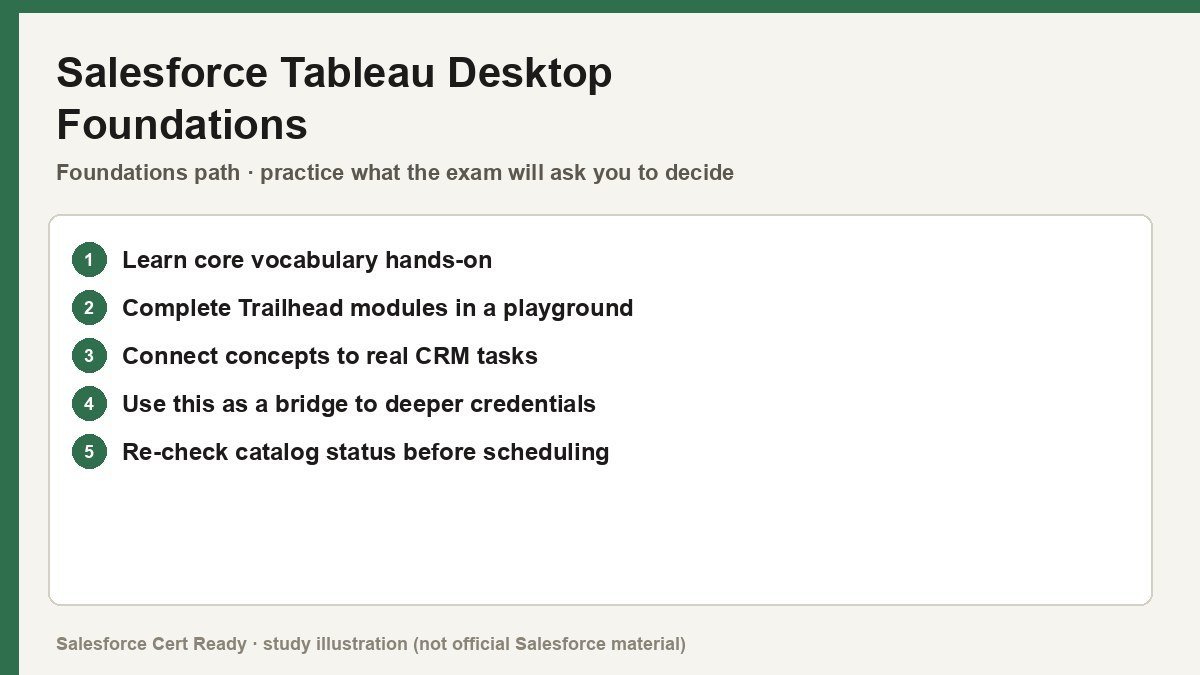
Study map for Salesforce Tableau Desktop Foundations. Confirm objectives on current Salesforce sources.
Salesforce Tableau Desktop Foundations
Catalog status checked July 19, 2026: Available.
Current credential snapshot
| Item | Current listing |
|---|---|
| Credential | Salesforce Tableau Desktop Foundations |
| Track | Foundations |
| Level in source inventory | Entry |
| Exam code in source inventory | Analytics-101 |
| Price in source inventory | $75 USD |
| Availability | Available |
Exam format, objectives, pricing, and prerequisites can change. Confirm those details in Salesforce’s current exam guide before purchasing or scheduling an exam.
Study overview
📊 Stop making guesses and start making sense of your data.Salesforce Certified Tableau Desktop Foundations
The entry-point credential for proving you can actually navigate the Tableau interface and build meaningful visualizations.
At a Glance
| Feature | Details |
|---|---|
| Exam Code | Analytics-101 (or TDS-C01) |
| Duration | 70 Minutes |
| Questions | 40 multiple-choice/multiple-select |
| Passing Score | 48% (English), 55% (Japanese) |
| Cost | $75 USD |
| Delivery | Proctored (Online or Pearson VUE Center) |
| Prerequisites | None |
| Recommended Experience | 3+ months of hands-on Tableau Desktop practice |
Who Should Take This
- Aspiring Data Analysts: Individuals looking to break into the analytics field by validating their ability to clean and visualize data.
- Business Users: Professionals who use Tableau to interpret team performance but want to move beyond just viewing dashboards.
- Salesforce Ecosystem Partners: Consultants who need to demonstrate a foundational understanding of the Tableau product suite.
- Students/Interns: Entry-level candidates wanting a low-cost, high-signal credential to differentiate their resume.
What You’ll Prove
This certification moves beyond rote memorization to test your practical, hands-on ability to use the product. You aren’t just defining terms; you are interpreting how data reacts to specific UI actions. * You can connect to various data sources like Excel, CSV, and JSON while managing Live versus Extract connections.
- You can model data effectively by adding
Relationships,Joins, andUnionsto create a cohesive data source. - You can visualize information using a variety of chart types including
Bar Charts,Scatter Plots, andDual Axischarts. - You can analyze datasets by applying
Filters,Groups,Hierarchies, and basicCalculated Fields. - You can share insights by building interactive
DashboardsandStoriesthat are optimized for stakeholder consumption.
Exam Outline
| Domain | Weight | What’s Covered |
|---|---|---|
| Connecting to & Preparing Data | 23% | Live vs. Extract, Relationships, Joins, Unions, .TDS files, and metadata management. |
| Exploring & Analyzing Data | 37% | Dimensions vs. Measures, chart types, Filters, Sets, Groups, and basic calculations. |
| Sharing Insights | 25% | Dashboard layout, interactive actions, Stories, formatting, and exporting to PDF/PowerPoint. |
| Understanding Tableau Concepts | 15% | Discrete (Blue) vs. Continuous (Green) logic, aggregation, and the data pipeline. |
💡 In Notion, convert each domain row into a toggle to nest your study notes underneath.
Suggested Study Path
- Get Hands-on with Tableau Public. You cannot pass this exam by reading documentation alone. Download the Sample Superstore dataset and build every chart in the
Show Memenu. - Master the UI vocabulary. Know exactly what happens when you drag a field to the
Rowsvs.Columnsshelf, and understand the role of theMarks Card. - Internalize Color Logic. If you don’t understand why a field is Blue (
Discrete) or Green (Continuous), you will struggle with the visualization questions. - Complete the Foundations course. Use the official
Tableau Desktop I: Fundamentalstraining or equivalent Trailhead modules to cover the theoretical gaps. - Practice with Visuals. Take practice exams that use screenshots. You need to be able to look at a chart and identify which “pills” are on which shelves.
Watch Out For
- The “Noodle” vs. The Join: Tableau’s default modeling now uses
Relationships(the noodle). Know when to use a physicalJoinversus a logicalRelationship. - Aggregation Pitfalls: Remember that Tableau aggregates measures by default. Know how the view changes when you add a
Dimensionto theDetailmark. - Date Logic: Be ready for questions about
Date Parts(Discrete) versusDate Values(Continuous). One creates a header; the other creates a timeline. - Filter Hierarchy: Understand the difference between a standard
Dimension Filterand aContext Filter, especially how they impact performance.
Resources
- Official Exam Guide
- Tableau Desktop I: Fundamentals
- Trailhead: Get Started with Tableau Desktop
- Tableau Product Help Documentation
Stop guessing which pill goes where and start building dashboards that actually tell a story. If you can’t explain the difference between blue and green, you aren’t ready yet.
Official status sources
Catalog status last verified: 2026-07-19.